Given an object where you doesn't know where it is instantiated, you can use the xGlobal class to test it.
xGlobal::objectOnServer(ioFlatFile)
Wednesday 7 December 2011
Friday 11 November 2011
Performance tuning using Trace Parser (Dynamics AX 2012)
On the text below, I'll be going through some traces and analysis using Trace Parser for Dynamics AX 2012.
It will covers:
I've created a demo class to shows the execution duration for each of the section mentioned above, below are the method name and its duration. You can download the XPO file from here.
Each pair of the method in the screenshot below has similar code, but only with a small difference, it makes it easier for you to do a comparison of how these small changes can make the code run faster. I'll go through each of that in details in this post.

NOTE: TEC_TraceDemo class 'RunOn' property has been set to run from server.
RPC (shows using file)
Both the .testRPCServer() and .testRPCClient() has similar code, except where the file is opened.
In .testRPCServer(), the file is opened from server side (static server AsciiIo openFileServer(Filename _fileName)), then returned to parent method and do the reading line by line. For each of that reading, due to the file is opened from server, there's no RPC call involved.

In .testRPCClient(), the file is opened from client side (static client AsciiIo openFileClient(Filename _fileName)), then returned to parent method (which is running from server) and do the reading line by line. For each of that reading, due to the file is opened from client, the server process needs to make an RPC call to client to read the file.

Comparing both of the methods above with the trace parser, you can see that:
- The .testRPCServer() has 0 RPC call and takes 8.33ms
- The .testRPCClient() has 204 RPC calls and takes 56.05ms
With a small change of opening the file at server where the code is running, it reduces the RPC calls and makes it run faster.
*The code sample above is using "C" drive as the directory, that's just for testing. If the code is running from server and the path selected by user is "C" drive of their own machine, it will cause error. Consider using shared directory.

RPC (shows using Map)
Both the .testMapLessRPC() and .testMapMoreRPC() has similar code, except how the map is used. The sample code below simulate & shows the situation when a Map is instantiated at a form, then passed to server for processing.
*TEC_MapTest 'RunOn' property is set to "Client"
In .testMapLessRPC(), the map is instantiated from client side, then it pack and return the map to server, recreate it from server side. After that it loop through the server map. Each call to read from the server map does not involve RPC call due to the map is on server side.

In .testMapMoreRPC(), the map is instantiated from client side, then it return the map to server. After that it loop through the client map. Each call to read from the client map involve RPC call due to the map is on client side and the calling code is from server side.

Comparing both of the methods above with the trace parser, you can see that:
- The .testMapLessRPC() has 6 RPC call and takes 3.29ms
- The .testMapMoreRPC() has 19 RPC calls and takes 5.52ms
*Create the map at server side does incurs some overhead, at the background, it actually insert the map one by one again from the packed container. But comparing to the cost of RPC call when looping through the client map, it might be better to recreate it. But if you don't intent to loop through all the element in the map, then probably client map remains better. It it entirely up what's the functionality you're writing, you'll have to make your own judgement. The example here is just to show what's the impact and how it can make a difference.
Database call
Both the .bulkInsertTraceDemoTable_RIL() and .bulkInsertTraceDemoTable_INS() has similar code, except how they're inserted.
In .bulkInsertTraceDemoTable_RIL(), records is added into RecordInsertList class and do the insert at once at the end. This reduce the database call. Periodically if the buffer limit of the RIL is reached, it will make a database call to insert and flush the buffer. Then at the end of the method, it do the final insert (one database call).

In .bulkInsertTraceDemoTable_INS(), records is inserted each time .insert() is call. Each of this .insert() make a database call to SQL server to do the insert.

Comparing both of the methods above with the trace parser, you can see that:
- The .bulkInsertTraceDemoTable_RIL() has 19 database call and takes 556.34ms
- The .bulkInsertTraceDemoTable_INS() has 1008 database calls and takes 2,780.07ms

Another way of viewing it is by looking at the 'X++/RPC' tab.
Eg. If you have done a trace for a poor performance functionality, using this tab, you can identify which method takes most of the execution time (sort by 'Total inclusive (ms)' column) or which method runs too many times (sort by 'Count' column). This gives you an idea of which one should be picked up for performance review & analysis.

Record caching
Both the .testRecordCache_Cached() and .testRecordCache_NotCached() has similar code, except one is reading from cached record and another one is not.
TEC_TraceDemoTable has a unique index on 'Field1' and doesn't have any index for 'Field3'
In .testRecordCache_Cached(), within the loop, the first read issue a database call and cached the record. Then on subsequent read, it read from cache, no database call needed. The ::dummyStatic() does not do anything, it is just to let it appear in the Trace Parser, make it easier to sees that it doesn't make a database call.

In between the ::dummyStatic(), the select statement didn't shows up due to it read from cache, doesn't make database call.

In .testRecordCache_NotCached(), within the loop, for each select, due to the query criteria 'Field3' does not have a unique index, it needs to make a database call to SQL server to read the data.

In between the ::dummyStatic(), the select statement shows up due to it needs to make a database call to SQL server to read it.

Comparing both of the methods above with the trace parser, you can see that:
- The .testRecordCache_Cached() has 1 database call and takes 48.59ms
- The .testRecordCache_NotCached() has 101 database calls and takes 247.02ms

Method call
Both the .testMethodCallInline() and .testMethodCallInner() has similar code, except one is running the counterBuffer++ within the loop and another one is running counterBuffer++ through another method.
In .testMethodCallInline(), it execute the 'counterBuffer++' within the loop, didn't involve passing control to another method.

In .testMethodCallInner(), it calls increaseValue() within the loop, which execute the 'counterBuffer++' for each of the call. For each of the loop, it pass the control to the child method, then back to parent method when it is finished.

Best practise is to have a separate method to do a specific task, then it can be reused somewhere else (Eg. the inner method, it usually is another method, I just write it as inner method to make it easier to read). But sometimes, on a performance intensive process where milliseconds does matter, we might have to break the rule. I'm not suggesting to always do that, the example here is just to show what difference it could make.
Comparing both of the methods above with the trace parser, you can see that:
- The .testMethodCallInline() takes 238.59ms
- The .testMethodCallInner() takes 974.41ms

Set / row by row operation
Both the .testSetOperation() and .testRowByRow() has exactly the same code except the table being used is different.
The .insert(), .update(), & .delete() method for table TEC_TraceDemoRowByRowTable has been overwritten but not for table TEC_TraceDemoSetOperationTable.

In .testSetOperation(), due to the .insert(), .update(), & .delete() has not been overwritten, it make one database call to do set operation. Eg. Insert 50 records, 1 database call.

In .testRowByRow(), the method .insert(), .update(), & .delete() has been overwritten, the set operation is downgraded to row-by-row operation and make one database call for each record it operate on. Eg. Insert 50 records, 50 database calls.
It will downgrade to row-by-row operation if either of the following conditions is true:
- insert() / update() / delete() is overwritten
- Is temp table
- Has database logging setup on that table
- Alert is set on that table
- Record level security is configured for that table

Comparing both of the methods above with the trace parser, you can see that:
- The .testSetOperation() has 10 database calls and takes 60.07ms
- The .testRowByRow() has 27 database calls and takes 184.28ms

Queries
In testQuery1(), 'Field1' is the unique index for table TEC_TraceDemoTable, any query with that as criteria will make it cache the record. 'Field5' is not unique index, query result with that criteria will not be cached.
Each query in the screenshot is explained by the comment next to it.

3 database call due to only one query can make use of the cached record.

Each query in the screenshot below is explained by the comment next to it.

1 database call due to 3 queries can make use of the cached record.

In .testQuery3(), both query has the same criteria, but with different field list.
First query only select 'ItemId' and 'InventDimId'.
Second query select all fields.

First query cost 0.36ms and second query cost 1.31ms.
By reducing the field list, it reduce the execution time.
Imagine if this is a validation section of an import process which imports 1 million records, reducing the field list will save 1,000,000ms, which translates to 16.67 minutes.

In .testQuery4(), both query has the same field list, but with different criteria.
I added a non-unique index in InventTrans table for 'InvoiceId'.
There's no index for field 'PickingRouteId'.
First query has the help from the index.
Second query doesn't have the help from any index.

With the help from index, the query takes 0.54ms.
Without the help from index, it takes 26.02ms.
This post focus on Trace Parser rather than on query tuning and indexing, so I'll skip that here.
Screenshot below shows how you can make use of Trace Parser to start looking into what needs to be optimized.

The SQL tab is where you can look for problematic query easily by sorting it in descending order.
Either sort it in descending by 'Inclusive Total (ms)' or 'Exclusive Total (ms)' column.

Summary of all 4 queries method.

Related (updated on 18/06/2012):
- Joining permanent table with temp table
http://mybhat.blogspot.co.uk/2012/05/joining-permanent-table-with-temp-table.html - Dynamics AX regular expression - match()
http://mybhat.blogspot.co.uk/2012/06/dynamics-ax-regular-expression-match.html
Wednesday 9 November 2011
London Student Fees Protest 09/11/2011 (9 November 2011)
Recorded this protest this afternoon when going out for lunch from office.
Another peaceful protest, no violence, yet.
Another peaceful protest, no violence, yet.
Thursday 27 October 2011
AX query/filter with other relative field
One of my colleague posted a question, how do we filter Dynamics AX table with value from another field.
The solution is to put the field name in the query criteria.
An example is better than explaining in words, here goes the sample.
*Remember to put the parentheses () around the query criteria else you'll get error.
*Remember to put the parentheses () around the query criteria else you'll get error.
This is the data before any filter

Then apply this filter

You’ll get this

So it looks like it does return the correct result

Tuesday 25 October 2011
Form changes crashed AX client
Recently I made changes to a form and while the form compiled OK and there isn't anything wrong within the code, it keep crashing the AX client when opening it. Debugging into the crashing, it was found that the crashing happens at "sysSaveSetup.loadFormSetup();" in "\Classes\SysSetupFormRun\init".
During the development, several changes is made and throughout the testing, I open and closed the form frequently, it saved the usage data (Eg. the field setup, splitter dragged to other position, and etc). After further changes, the saved usage data does not compatible with the form anymore and everytime when it tries to load it, it crash the AX client.
Quickest solution: Delete the usage data.
- Path: Tools > Options > Usage data (button)
- Look for the record with your form name and delete it
Friday 14 October 2011
Dynamics AX 2012 RTM demo data
Microsoft Dynamics AX 2012 RTM demo data: https://mbs.microsoft.com/customersource/downloads/servicepacks/MicrosoftDynamicsAX2012.htm

Direct links
- Demo Data for Microsoft Dynamics AX 2012 SYS layer
https://mbs2.microsoft.com/fileexchange/?fileID=8ff98e54-b89d-4a67-b10d-217dd7346059 - Demo Data for Microsoft Dynamics AX 2012 Process Manufacturing
https://mbs2.microsoft.com/fileexchange/?fileID=4642ddda-e7e2-4b5b-8cab-af18105f287c - Demo Data for Microsoft Dynamics AX 2012 Services Industries
https://mbs2.microsoft.com/fileexchange/?fileID=496fc947-3f12-4689-8d77-98e471937ac0
How to deploy all AX2012 report
There're 3 different ways to deploy Dynamics AX2012 reports:
- Through AOT
AOT > SSRS Reports > Reports > right click on report > Deploy Element
- Through Visual Studio
Open the report project > Right click on the project or solution node > Deploy
- Through PowerShell
Publish-AXReport -ReportName *
Through AOT
- Go to AOT > SSRS Reports > Reports > (right click on report) > Deploy Element
- Right click on the report node
- Click "Deploy Element"
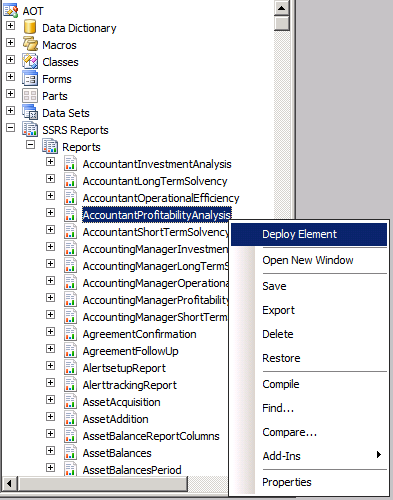 |
| Deploy AX2012 report through AOT |
Through Visual Studio
- Open the report project
- Right click on the project or solution node
- Click "Deploy"
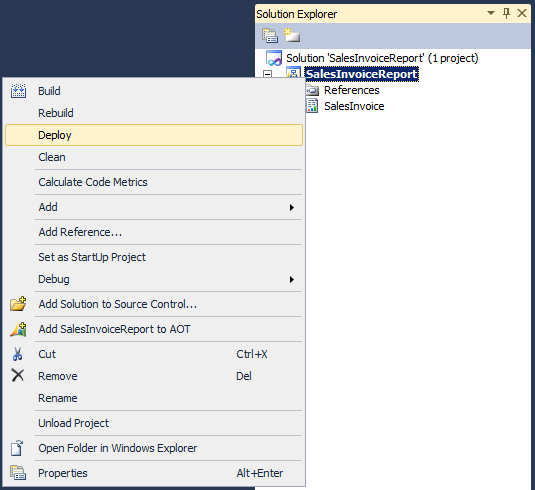 |
| Deploy AX2012 report through Visual Studio |
Through PowerShell
- Go to: Start > Administrative Tools > Microsoft Dynamics AX 2012 Management Shell
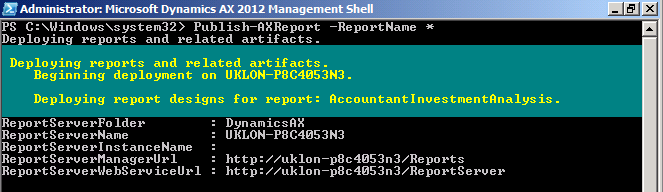
- Then enter Publish-AXReport -ReportName *
This will deploy all AX2012 reports into report server, you might want to do this after the initial installation as the report server doesn't have all the report there yet. It takes about 20 minutes for me to deploy all the reports (that's on my Hyper-V image, if run on better spec server, it could be much faster).
If you want to deploy a specific report, just replace the wildcard (*) with the report name.
Eg. Publish-AXReport -ReportName SalesInvoice
*It is the report name under AOT > SSRS Reports > Reports > SalesInvoice, not the project name under AOT > Visual Studio Projects > Dynamics AX Projects > SalesInvoiceReport
 |
| Publish-AXReport -ReportName * will deploy all report (use wildcard to deploy full set of report) |
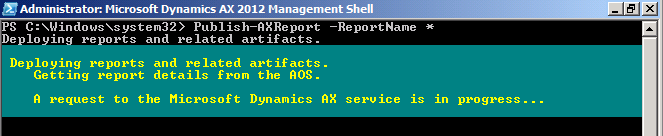 |
| Report deployment in progress |
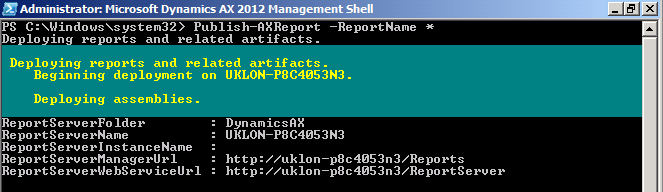 |
| Report deployment in progress |
 |
| Report deployment in progress |
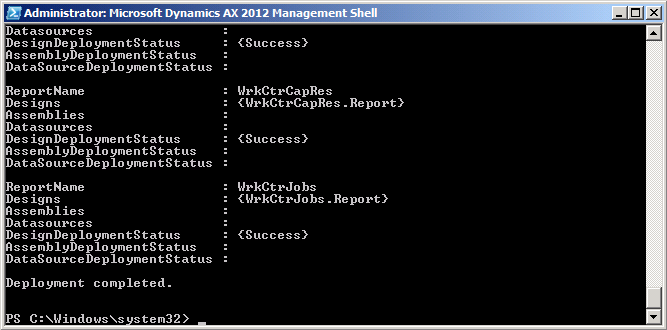 |
| Report deployment completed |
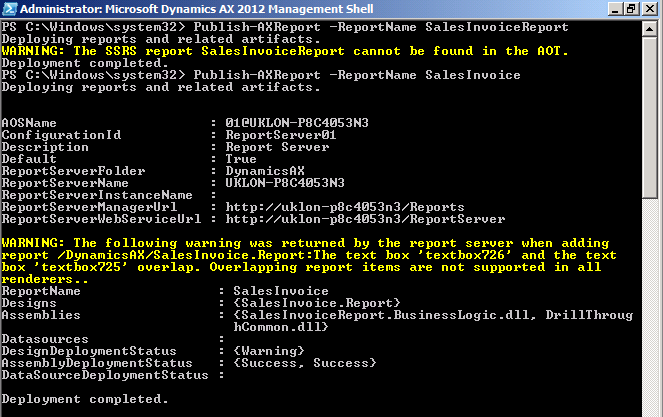 |
| Report name should be the name under AOT > SSRS Reports > Reports > SalesInvoice, not the project name under AOT > Visual Studio Projects > Dynamics AX Projects > SalesInvoiceReport |
PowerShell grid view (Out-GridView) & Integrated Scripting Environment
When working in PowerShell, there're situation where the data is not fully displayed or difficult to read due to the way it was presented. Rather than showing them in a long list, PowerShell Integrated Scripting Environment (ISE) provides a convenient way to present and read them.
Follow these steps to install PowerShell Integrated Scripting Environment (ISE):
1. Go to: Server Manager > Features > Add features.
2. Check the checkbox for "Windows PowerShell Integrated Scripting Environment (ISE)"
3. Click "Next"
4. Click "Install"
5. Click "Close"

To show result in grid view, you can pipe it to Out-GridView.
Example with and without Out-GridView
> Get-Command -Module Microsoft.Dyn*
> Get-Command -Module Microsoft.Dyn* | Out-GridView
> Get-AXModel | Out-GridView
 |
| Get-Command -Module Microsoft.Dyn* | Out-GridView |
 |
| Get-Command -Module Microsoft.Dyn* |
 |
| Get-AXModel | Out-GridView |
Subscribe to:
Posts (Atom)